

It is March 1990. Belgium is small, dense, and airspace-conscious, a country where “nothing interesting happens” is often the official tone until it suddenly is not. In the record that survives, the Belgian Air Force scrambles F-16s. Pilots obtain radar “lock-ons.” And yet the why of it remains unresolved in the public story. (National Archives)
This reads like a mystery, from a data distance, it reads like something else: a time-stamped spike, a mobilization signature, and a failure mode in collection.
This investigation is about that second reading.
Not “Can we predict the universe?” but “Could we, with the tools available from the 1980s through the 2000s, have forecast UAP reporting surges and high-value ‘collection windows’ well enough to be waiting with better sensors and better forms?”
That distinction matters. RAND’s 1968 internal draft put the idea on paper in plain language: standardized reporting was needed “so that times and locations of appearances may be anticipated” and objective data obtained. (RAND Corporation)
That is not proof that UAP themselves are forecastable. It is, however, a documented recommendation that forecasting was methodologically imaginable if the reporting substrate became structured.
What follows is a deliberately evidence-separated reconstruction: documented facts first, then analytical inference, then clearly fenced hypotheses.
The thesis we can defend, and the one we cannot
Documented record
By the late Cold War and into the early internet era, there already existed:
Civilian reporting networks that generated large volumes of structured or semi-structured reports (for example NUFORC’s databank, explicitly described as a large independently collected online archive). (nuforc.org)
Mature investigative and archiving programs inside states (France’s GEIPAN inside CNES, explicitly tasked with collecting, analyzing, investigating, publishing, and archiving UAP reports). (cnes-geipan.fr)
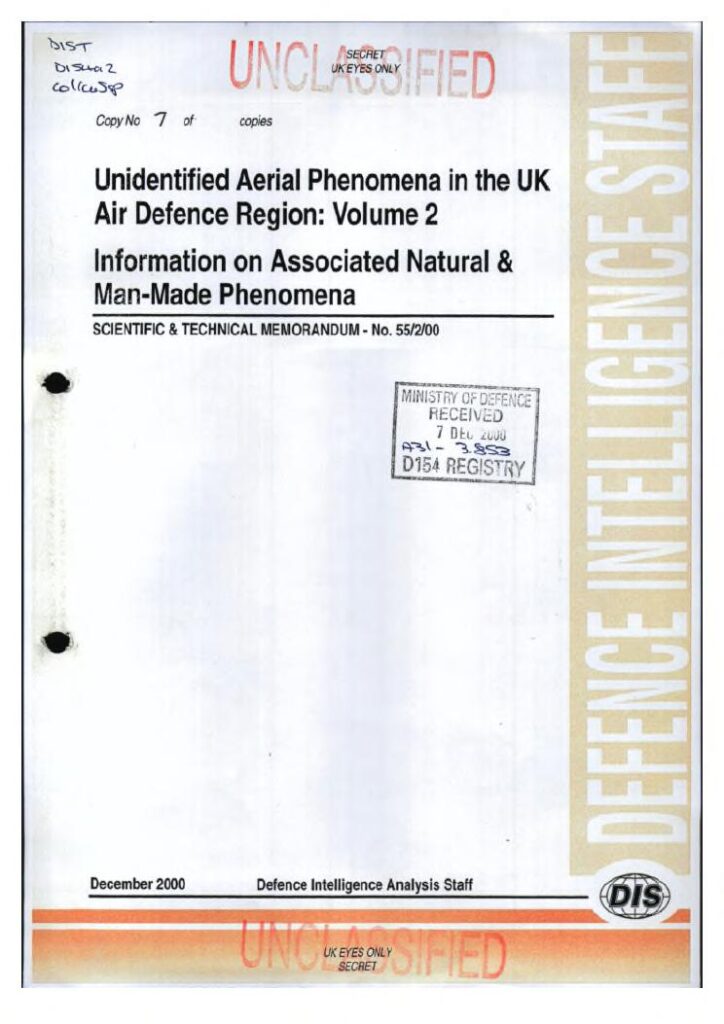
Intelligence or defense studies that aggregated decades of reports into institutional analysis (the UK’s Project Condign, documented by the UK Information Commissioner’s Office as a study culminating in a 460-page report produced in December 2000). (ICO)
Persistent “window areas” where instrumentation could run continuously (Hessdalen’s Blue Box, described as an autonomous multi-sensor system monitoring the sky since 1998 with an explicit goal of capturing measurable, verifiable data). (Project Hessdalen)
Analytical inference
Given those ingredients, it is methodologically plausible that an 1980s–2000s “ team could have forecasted:
- reporting surges (when a population is most likely to report),
- and collection windows (where and when deploying sensors would maximize the probability of capturing multi-sensor data),
Regardless of the underlying phenomenon’s ontology remaining unknown.
Hypothesis
It remains unproven that UAP “appearances” themselves, as opposed to human reporting spikes, are forecastable in a strong sense.
Why “predicting UAP” often collapses into predicting human reporting
If you have ever tried to build a dataset from witness narratives, you learn quickly that “signal” and “visibility” are not the same thing.
Warm evenings produce more witnesses.
Media coverage changes attention thresholds.
Military training can generate luminous events that flood call lines.
A single viral clip can retroactively inflate “I saw it too” reports months later.
A forecasting system that ignores those dynamics will hallucinate patterns. A forecasting system that models them can do something useful: tell you where to place instruments and investigators when the next wave of reports is likely to crest.
To see how this plays out, we go case by case.
Case study 1: Belgium’s 1989–1990 wave as a prototype “mobilization dataset”
Documented record
The UK National Archives highlights guide summarizes the Belgian wave in terms that are unusually operational for UAP history: Belgian Air Force F-16s were scrambled, and pilots obtained radar “lock-ons,” but the phenomenon was not explained in that record. (National Archives)
The National Archives’ own “UFO reports” collection page likewise notes the scramble as part of the historical archive narrative. (nationalarchives.gov.uk)
Analytical inference
From a data-first perspective, Belgium provides a template of fields you would want to capture systematically:
- timestamped radar events and intercept logs,
- location polygons of reports,
- witness clustering after the fact,
- and the discrepancy between “air defense sensors reacted” versus “public narrative resolved.”
If your goal is forecasting collection windows, Belgium is gold not because it proves exotic craft, but because it shows a state crossing a threshold: committing fighters to an unknown.
That threshold is forecastable in a weaker but practical sense. If your model can’t forecast “tonight is the kind of night that generates an intercept,” it is not useful. Belgium is the training set.
Hypothesis
If UAP episodes involve adaptive behavior (for example, appearing near response assets), then intercept-trigger nights might cluster around particular readiness cycles or air defense training tempos.
Case study 2: JAL 1628 and the discipline of negative sensor evidence
Documented record
The JAL 1628 episode is widely cited because it sits at the intersection of aviation procedure, witness testimony, and radar ambiguity. A contemporaneous FAA memo states: “Radar data recorded by Anchorage Center does not confirm the presence of the traffic reported by Flight 1628.” (The Black Vault)
That single sentence is what a serious data-first approach looks like. It preserves the witness report while constraining the sensor claim.
Analytical inference
For forecasting, JAL 1628 is not primarily “a solved or unsolved mystery.” It is a schema lesson:
- You must encode “reported by crew” and “confirmed by radar” as separate variables, not as a blended headline.
- You must treat the mismatch itself as data.
A 1980s–2000s pipeline that swallowed such cases without explicit “sensor-negative” flags would generate false correlations.
Hypothesis
If there are UAP events that are intermittently sensor-elusive, then “radar-negative, witness-positive” clusters might themselves be predictive of where to upgrade sensor modalities (for example passive RF, IR, or multi-site triangulation). This is a hypothesis about data strategy, not about the phenomenon’s nature.
Case study 3: Hessdalen’s Blue Box and the birth of “always-on” anomaly capture
Documented record
Project Hessdalen describes a program explicitly oriented toward measurable, verifiable data and open sharing. It describes the “Blue Box” as an autonomous multi-sensor anomaly detection system continuously monitoring the sky since 1998. (Project Hessdalen)
The project’s historical material also places organized investigations back into the 1980s era of field campaigns. (old.hessdalen.org)
Analytical inference
Hessdalen is what UAP forecasting looks like when you stop chasing reports and start instrumenting geography.
Instead of asking, “Where will UAP appear next?” you ask:
- “Where is the phenomenon reported recurrently enough that continuous monitoring has positive expected value?”
- “What sensor suite survives winter, power constraints, and false positives?”
- “What metadata lets future analysts validate or falsify interpretations?”
In forecasting terms, Hessdalen is a “persistent hotspot prior.” It compresses uncertainty: even if 90 percent of triggers are mundane, the remaining residuals are repeatedly observable under controlled sensor conditions.
Hypothesis
If some UAP manifestations are tied to specific terrain, atmospheric boundary conditions, or geophysical variables, then hotspot instrumentation is not just observational, it is predictive. This is unproven, but Hessdalen is the right kind of experiment.
The institutional backbone: GEIPAN, Condign, and COMETA as “pre-forecast infrastructure”
GEIPAN as a national intake and archive system
Documented record
GEIPAN’s own CNES-hosted material states plainly that GEIPAN is a CNES technical department whose mission is to collect, analyze, investigate, publish, and archive UAP sighting reports. (cnes-geipan.fr)
Its methodology is formalized, and it describes a classification approach (A, B, C, D) after analysis, with a stated process from receiving testimony through publication. (cnes-geipan.fr)
Analytical inference
GEIPAN is what many countries lacked in the 1980s and 1990s: a consistent form.
Forecasting thrives on stable schemas. Even if 95 percent of cases resolve as “identified” or “probably identified,” the remaining fraction benefits from:
- standardized witness questionnaires,
- environmental cross-check agreements,
- and publication workflows that preserve metadata.
A forecasting model built on GEIPAN-like fields would outperform one built on newspaper clippings, not because newspapers are useless, but because they are non-uniform instruments.
Project Condign as a defense-intelligence aggregation event
Documented record
The UK Information Commissioner’s Office decision notice describes Project Condign as a DI55 study culminating in a 460-page report produced in December 2000. (ICO)
Separately, archival copies of the released report exist in public repositories, reflecting the report’s post-FOI public life. (Internet Archive)
Analytical inference
Condign matters for forecasting in an unglamorous way: it is evidence that a defense organization believed the dataset was worth centralized synthesis.
Even if one disagrees with its interpretations, the meta-fact is operationally important:
- someone had a pile of reports large enough to justify a long report,
- and that pile likely had internal coding practices.
That is “forecastable substrate,” the thing you need before prediction is even a coherent word.
COMETA as a prestige-vector report, not an official state verdict
Documented record
The COMETA report (widely circulated in translation) explicitly frames itself as a report written to inform senior leadership, stating that high-position individuals agreed to write a report devoted entirely to the UAP problem, and that “questions of national interest” justified providing this information to the Chief of State and Prime Minister. (ia600304.us.archive.org)
Analytical inference
COMETA is not a sensor dataset. It is a governance artifact: an attempt to shift the topic from pop culture to strategic attention. Forecasting is not just math. It is political permission to collect.
COMETA signals that, by the late 1990s, at least some elite constituencies were trying to move the question into “statecraft language”: defense implications, airspace integrity, and institutional responsibility.
Hypothesis
COMETA-style pressure may correlate with improved data practices over time (more formal intake, more archiving, more cross-agency cooperation). That relationship is plausible but not demonstrated here.
Civilian reporting networks: NUFORC and MUFON as the “shadow sensor grid”
Documented record
NUFORC describes its databank as a large independently collected online archive of UAP reports. (nuforc.org)
MUFON’s own history page places its formal beginning in 1969 and frames its growth into a broader organization over time. (MUFON)
Analytical inference
In the 1980s through early 2000s, civilian networks were often the only systems willing to log high-volume witness data without the “national security gag” effect.
That creates a paradox:
- Civilian datasets are noisy and heterogeneous.
- But they are often the only long-running, continuously updated sources.
A data-first forecasting approach in that era would likely have looked like this:
- Use civilian networks (NUFORC, MUFON-style reports) to detect surges early. (nuforc.org)
- Use institutional archives (GEIPAN) to validate methods and harmonize schema. (cnes-geipan.fr)
- Use defense-intelligence summaries (Condign) to understand what governments were already collecting and how they coded it. (ICO)
This is not romantic. It is the same way epidemiology often works: open reports first, then clinical validation, then institutional synthesis.
The Phoenix Lights problem: when a report surge is real, and the “object” may not be
Documented record
Contemporaneous reporting quotes military officials saying that visiting jets from the Maryland Air National Guard used high-intensity flares over a bombing range near Phoenix on March 13, 1997, the same night many people reported unusual lights. (Deseret News)
We treat the Phoenix Lights as a mass sighting case in its category structure, reflecting its role as a major reporting surge regardless of attribution debates.
Analytical inference
Phoenix is the warning label on forecasting.
A naive model might “discover” that mid-March nights in Arizona produce huge UAP clusters. A disciplined model asks:
- Was there scheduled training?
- What illumination ordnance exists and what are its visual signatures at distance?
- How does media coverage alter report volume and retrospective reporting?
Even if one believes that Phoenix contains an anomalous core (and many witnesses do), the flare explanation for at least part of the event demonstrates why forecasting “report waves” is the defensible near-term target: waves can be triggered by multiple causes, including mundane ones, and still overwhelm reporting channels.
Hypothesis
A mature forecasting pipeline would treat “known training windows” as confounders, not dismissals. The forecast product would be: “high likelihood of mass reporting tonight,” plus a confidence estimate that the cause will be mixed.
Remote viewing-era materials: a parallel attempt to operationalize the anomalous
Documented record
CIA Reading Room documents include an evaluation of the remote viewing program. In one of the evaluation documents, language appears explicitly cautioning that evidence has not been provided that clearly demonstrates the causes of “hits” are due to paranormal phenomena. (CIA)
Analytical inference
Why include this in an article about forecasting UAP report surges?
Because it shows a pattern that repeats across anomalous domains:
- Institutions are willing to fund and test ideas that promise predictive leverage.
- They also erect evaluative gates when results do not meet operational standards.
For UAP forecasting, this is instructive. It implies that any serious predictive claim must survive an adversarial evaluation culture.
Hypothesis
A “hybrid” UAP forecasting program that mixes sensor data with human anomalous cognition claims is historically consistent with how institutions sometimes explore edge capabilities, but it is scientifically contentious and would require stringent controls. This remains speculative.
The forecasting pipeline that was plausible in the 1980s–2000s
If you strip away today’s machine learning glamour, the core pipeline could have been built with late-20th-century tools:
Intake standardization
- Adopt a GEIPAN-like witness questionnaire structure (time, azimuth, elevation, duration, weather, witness role, and artifacts). (cnes-geipan.fr)
- Explicitly encode sensor states: radar-confirmed, radar-negative, unknown (JAL 1628 teaches why). (The Black Vault)
Data fusion across channels
- Civilian reports as early warning (NUFORC-style). (nuforc.org)
- Official archives for higher-confidence case files (GEIPAN). (cnes-geipan.fr)
- Defense-intelligence syntheses for macro-patterns (Condign). (ICO)
Forecast targets that do not overclaim
Instead of predicting “UAP will appear,” the era-appropriate forecast target would be:
- probability of a reporting surge in region X over window T,
- probability that the surge will include high-value reports (trained observers, multiple witnesses, or persistent hotspots).
RAND’s 1968 recommendation is consistent with exactly this framing. (RAND Corporation)
Persistent hotspot monitoring
Hessdalen is the model: continuous multi-sensor monitoring in a recurrent area, designed explicitly to capture measurable data. (Project Hessdalen)
Confounder modeling
Phoenix demonstrates why confounders must be explicit: scheduled training and illumination events can generate a mass wave. (Deseret News)
Environmental correlation work: where interesting ideas exist, and where certainty does not
Documented record
A PubMed-indexed paper by Persinger (1985) explicitly explores geomagnetic variation as a possible enhancement stimulus for UAP reports (in his framing). (PubMed)
Analytical inference
This matters less as “proof” and more as evidence that, by the 1980s, some researchers were already attempting correlation studies between environmental variables and report rates.
Hypothesis
A forecasting pipeline could have incorporated geomagnetic indices as one feature among many, with strict safeguards against spurious correlation. The existence of exploratory work does not validate the predictive claim; it only demonstrates that the conceptual move was already being attempted.
Implications: what a data-first approach changes, even if the mystery remains
For research
- It forces the field to treat “unknown” as an output category, not a story genre.
- It creates auditable chains: what was seen, what was measured, what was not confirmed.
For government and aviation stakeholders
- It clarifies where the real risk lives: not “belief,” but airspace integrity and response triggers.
- It supports a pragmatic posture: standardized reporting improves the ability to anticipate times and locations of appearance events in the reporting sense, aligning with RAND’s long-ago methodological suggestion. (RAND Corporation)
For the public
- It reduces the false binary of “everything is mundane” versus “everything is extraordinary.”
- It legitimizes the most important question: where is the high-quality, multi-sensor residual that remains after confounders?
Claims Taxonomy
Below, “Claim tier” applies to the specific claim described, not to every interpretation around the case.
| Case / Asset | Timeframe | What is being claimed here | Evidence type used in this article | Claim tier |
|---|---|---|---|---|
| Belgian wave (intercept response) | 1989–1990 | F-16s were scrambled; radar “lock-ons” occurred | UK National Archives highlights guide | Verified (National Archives) |
| JAL 1628 (radar constraint) | 1986 | FAA memo: Anchorage Center radar did not confirm reported traffic | FAA memo PDF | Verified (for the memo statement) (The Black Vault) |
| Hessdalen (instrumented monitoring) | 1980s–2000s | Blue Box is an autonomous multi-sensor system monitoring since 1998; goal is measurable, verifiable data | Project Hessdalen pages | Verified (Project Hessdalen) |
| GEIPAN (institutional mission) | 1980s–2000s | GEIPAN is a CNES technical department tasked to collect/analyze/investigate/publish/archive UAP reports | CNES/GEIPAN mission pages | Verified (cnes-geipan.fr) |
| Project Condign (existence and scope marker) | 1996–2000 | DI55 study culminating in a 460-page report produced Dec 2000 | ICO decision notice | Verified (ICO) |
| COMETA report (status) | 1999 | COMETA presented itself as an independent report intended to inform senior leadership on national-interest questions | COMETA report text | Verified (for what the report states about itself) (ia600304.us.archive.org) |
| Phoenix Lights (flare attribution claim) | 1997 | Military officials said flares were used over a bombing range that night | Contemporary news reports quoting officials | Probable (for “officials said,” not for full attribution of all sightings) (Deseret News) |
| NUFORC databank (archive function) | 1990s–2000s | NUFORC maintains a major online report archive | NUFORC databank page | Verified (nuforc.org) |
| MUFON (organizational existence/history marker) | 1969–2000s | MUFON began in 1969 and evolved organizationally | MUFON history page | Verified (MUFON) |
| Remote viewing evaluation (skeptical constraint) | 1995 | CIA evaluation documents caution that evidence does not clearly demonstrate paranormal causation | CIA Reading Room PDFs | Verified (for evaluation language) (CIA) |
| “Forecasting UAP waves was plausible” | 1980s–2000s | A structured pipeline could plausibly forecast reporting surges and collection windows | Synthesized from above + RAND recommendation | Probable (methodological plausibility), not proven (RAND Corporation) |
Speculation labels
Hypothesis
A proposed mechanism or forecasting approach that requires testing and could be wrong.
Witness Interpretation
A witness’s meaning-making layer (for example “structured craft,” “intelligent response”), distinct from raw description.
Researcher Opinion
An analyst’s interpretation built from patterns, comparisons, and models, not from a single primary document.
In this article, anything beyond the documented record is explicitly labeled as analytical inference or hypothesis.
Associated links and primary documents
RAND – “UFOs: What To Do?” (DRU-1571)
https://www.rand.org/pubs/drafts/DRU1571.html?utm_source=uapedia.ai
https://www.rand.org/content/dam/rand/pubs/drafts/2007/DRU1571.pdf?utm_source=uapedia.ai
UK National Archives – Highlights Guide (includes Belgium intercept summary)
https://cdn.nationalarchives.gov.uk/documents/aug-2009-highlights-guide.pdf?utm_source=uapedia.ai
UK National Archives – UFO reports collection page
FAA memo (JAL 1628) – “Radar data recorded by Anchorage Center does not confirm…”
https://documents.theblackvault.com/documents/ufos/jal1628/733667-001-012.pdf?utm_source=uapedia.ai
ICO Decision Notice (Project Condign)
https://ico.org.uk/media2/migrated/decision-notices/4031064/ic-295362-g0s9.pdf?utm_source=uapedia.ai
Project Condign report (public repository copy)
https://archive.org/details/condign-vol-2-1-258?utm_source=uapedia.ai
CNES/GEIPAN – Mission (English)
https://www.cnes-geipan.fr/en/node/58792?utm_source=uapedia.ai
CNES/GEIPAN – Missions, méthodes et résultats (French)
https://www.cnes-geipan.fr/fr/missions-methodes-et-resultats?utm_source=uapedia.ai
Project Hessdalen – Blue Box & measurable-data mission
https://www.hessdalen.org/home?utm_source=uapedia.ai
https://old.hessdalen.org/index_e.shtml?utm_source=uapedia.ai
NUFORC Databank
https://nuforc.org/databank/?utm_source=uapedia.ai
MUFON – Brief History
https://mufon.com/history-2/?utm_source=uapedia.ai
Phoenix Lights flare statements (contemporary reporting)
CIA Reading Room – Remote Viewing evaluations (AIR-era documentation)
https://www.cia.gov/readingroom/docs/CIA-RDP96-00791R000200180005-5.pdf?utm_source=uapedia.ai
https://www.cia.gov/readingroom/docs/CIA-RDP96-00791R000200180006-4.pdf?utm_source=uapedia.ai
COMETA Report (translation PDF copy)
References
CNES/GEIPAN. (n.d.). Mission & GEIPAN (English). GEIPAN. (cnes-geipan.fr)
CNES/GEIPAN. (n.d.). Missions, méthodes et résultats (French). GEIPAN. (cnes-geipan.fr)
Deseret News. (1997, July 26). Flares, not UAPs, caused light show, military says. (Deseret News)
Hessdalen.org. (n.d.). Project Hessdalen: Collect data (Blue Box). (Project Hessdalen)
Hessdalen.org. (n.d.). Project Hessdalen (old site): History and field investigations. (old.hessdalen.org)
Information Commissioner’s Office. (2024, September 10). Decision notice (Project Condign / DI55). (ICO)
Kocher, G. (1968). UFOs: What to do? RAND Corporation (DRU-1571). (RAND Corporation)
Las Vegas Sun. (1997, July 25). Military now says flares may be cause of mysterious lights. (Las Vegas Sun)
National Archives (UK). (2009). Highlights guide (includes Belgium intercept summary). (National Archives)
NUFORC. (n.d.). NUFORC Databank. (nuforc.org)
Persinger, M. A. (1985). Geophysical variables and behavior: XXI. Geomagnetic variation as possible enhancement stimuli for UAP reports preceding earthtremors. Perceptual and Motor Skills, 60(1), 37–38. (PubMed)
U.S. Central Intelligence Agency. (1995). An evaluation of the remote viewing program. CIA Reading Room. (CIA)
U.S. Central Intelligence Agency. (1995). An evaluation of remote viewing: Research and applications. CIA Reading Room. (CIA)
U.S. Federal Aviation Administration. (1986, December 18). Memorandum: Japan Air Lines Flight 1628 chronology (released document). (The Black Vault)
SEO keywords
UAP forecasting, predicting UAP waves, UAP data-first approach, UAP reporting surge prediction, Belgian UAP wave F-16 lock-on, JAL 1628 FAA memo, Project Hessdalen Blue Box, GEIPAN CNES mission archive, Project Condign DI55, COMETA report, NUFORC databank, MUFON history, Phoenix Lights flares Maryland Air National Guard, CIA remote viewing evaluation AIR, geomagnetic correlation UAP reports Persinger 1985, UAP collection windows, UAP data standards and reporting protocols